
Simulate first.
Move smarter.
invasSLOTTING shows you the operational impact of slotting changes in 3D and quantifies the expected gains before a single product is moved.
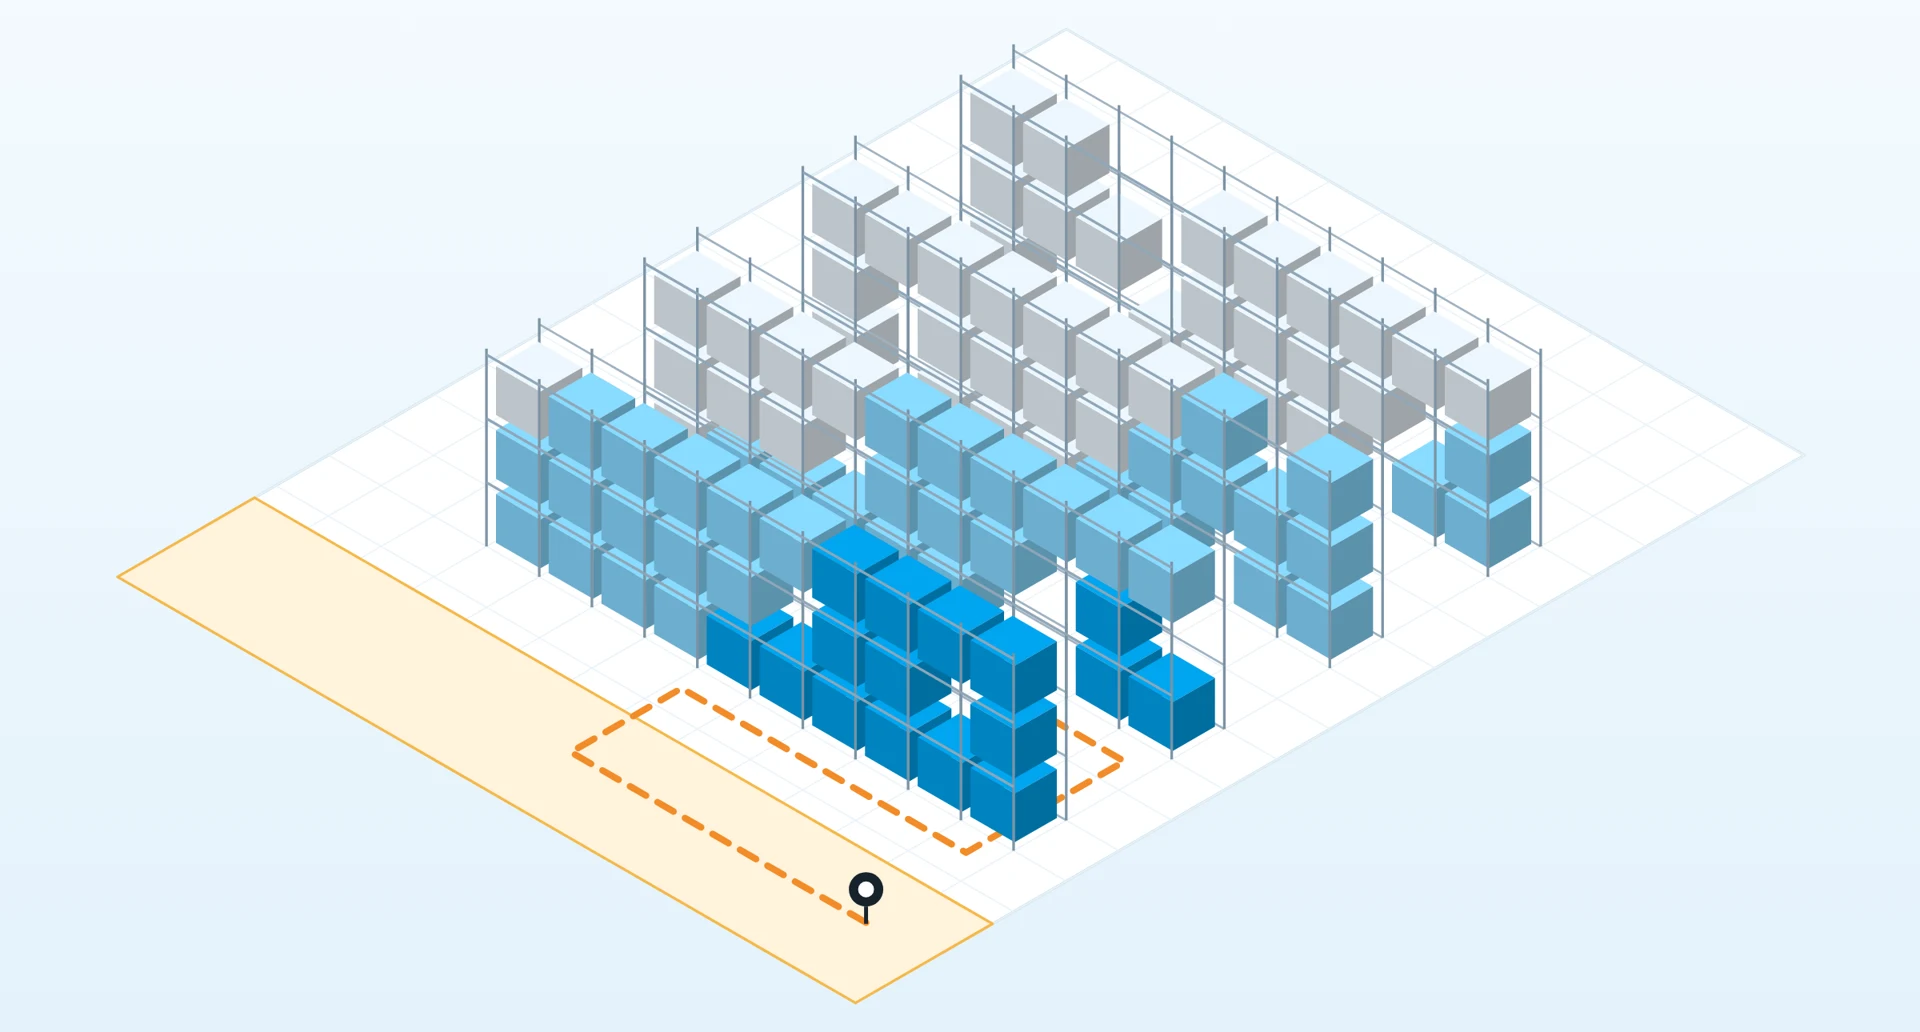
Travel is half of picking time. That’s where the opportunity is.
Potential results of a properly optimized operation:
less travel
higher productivity
lower picking cost
Reference ranges based on published logistics industry studies and cases (Tompkins et al., 2003; MWPVL; GEODIS, 2025). They are not a guaranteed result: invasSLOTTING calculates your distribution center’s result with your own data, before you move.
Key Benefits
Less travel per order line
The fastest-moving products sit in the most efficient picking zones, close to shipping.
Enter peak season in order
Identify which products should be relocated before a demand peak, so the distribution center doesn’t fall into disorder just when the pressure is highest.
You choose what to optimize
Depending on what your operation needs:
- Minimize distance
- Reduce picking times
- Balance zones
- Reduce replenishments
Locations that keep up with demand
What moved fast in March doesn’t move fast in September. The proposal is recalculated with actual and forecast demand, not with the supervisor’s memory.
Better use of the space you already have
Takes each product’s volume and weight into account to free up locations without moving a single rack.
Rules that are always respected
Weight, temperature and expiry come from the invasWMS item master, and zones that cannot be swapped are respected.
Evidence-based decisions before you move
See the before and after in 3D, with the estimated impact on travel, movements, productivity and location usage.
Your business case, before you move
invasSLOTTING doesn’t promise a generic percentage: it calculates yours. The 3D simulation becomes a business case before a single pallet is touched.
The before and after, in 3D
Your current layout next to the optimized proposal, on the same distribution center.
The benefit, quantified
Estimated impact on travel, movements, productivity and location usage.
The cost of getting there
How many operators and how many hours the relocation takes, so you can compare what you invest with what you gain.
How it works
1. Reads your operation
Historical and forecast demand, picking frequency, turnover, volume and weight of each product, and the actual shape of your locations.
2. Simulates and proposes
Shows in a 3D model how it looks today and how it would look, with a conservative and an aggressive scenario, and tells you how many operators and how many hours the change takes.
3. You decide when to apply it
Moves arrive as tasks in the same invasWMS panel and are carried out within normal operations. They can be paused midway, and the distribution center never has to stop.
The strategies, and the rules no location can break
OPTIMIZATION ENGINE
Classification calculated from actual picking and forecast demand
DEMAND ANALYSIS
The before and after, before anything moves
3D SIMULATOR
The change, carried out within daily operations
RELOCATION TASKS
Want to see how your distribution center would look?
Who it’s for: high-demand distribution centers with a wide assortment and large differences in turnover between products: food distribution, spare parts, retail and logistics operators.
We’ll show you the simulation built on the shape of your operation, with no commitment.